Bristol Old Vic – Advantage Dashboard
Hear about Bristol Old Vic’s use of the Advantage Dashboard – Baker Richards’ latest service designed to support revenue management, forecasting and marketing planning for performing arts organisations.
Bristol Old Vic (BOV) was one of the earliest adopters of the Advantage Dashboard. BOV has a wide-ranging programme of longer runs and one-off dates covering drama, family shows, comedy, dance and more across their 540-seat venue main house and 188-seat studio. Like so many arts organisations, BOV is committed to ensuring its accessibility across the programme, however this has to be balanced with revenue generation to support the theatre through ticket sales.
Day-to-day use
The Advantage Dashboard is being used to communicate information across the organisation to inform both day-to-day actions and strategic planning. It has helped BOV manage their resources and budgets across a busy programme, and the Dashboard comes into its own for reporting up to senior management as well as informing weekly tactical meetings across marketing and ticketing to decide on priorities for marketing resource and opportunities for revenue management.

A Christmas success story
In the run up to Christmas 2022, BOV had two major shows: Hamlet (running October – November) followed by The Nutcracker (November – January).
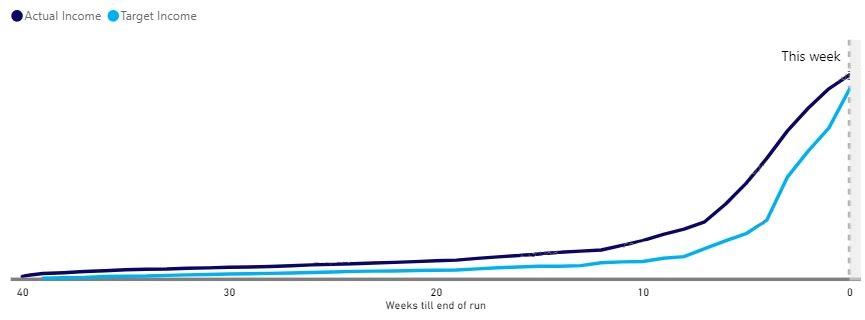
Hamlet had strong sales from on sale, and the Dashboard allowed BOV to identify this early and implement price changes earlier in the sales cycle than they might have done previously.

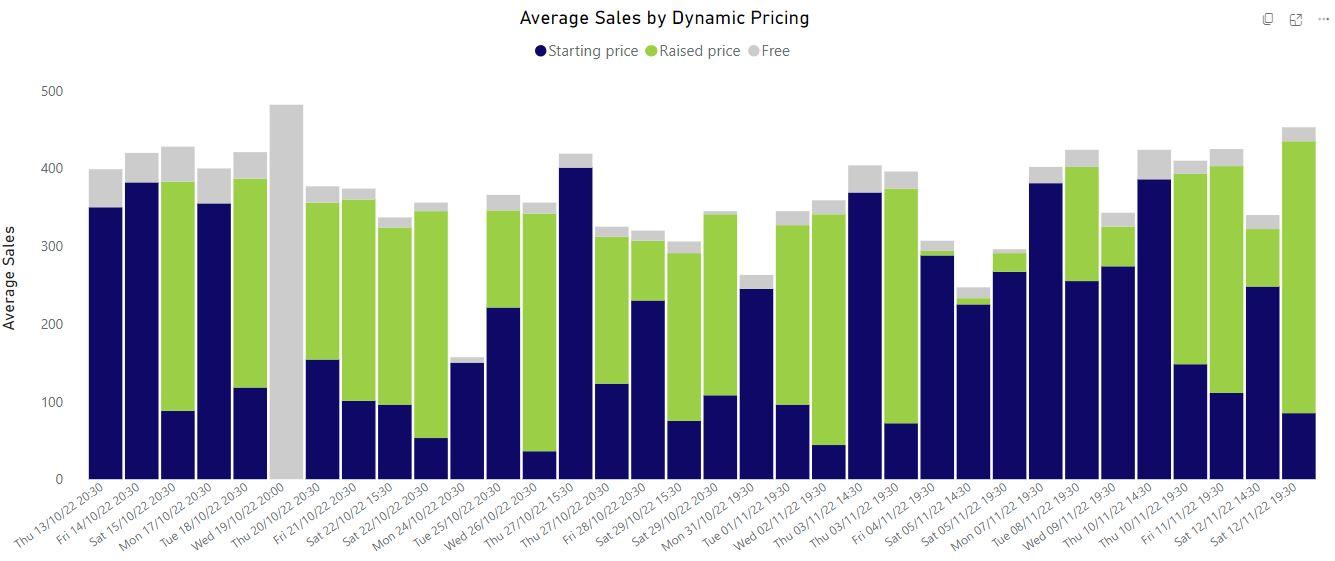
This enabled them to maximise incremental income from dynamic pricing based on the success of the show.

Another benefit of being able to monitor sales in the Dashboard, was identifying the point at which they were able to confidently say that Hamlet was doing well enough to switch marketing focus to The Nutcracker to optimise sales for their Christmas show.
The Nutcracker had at this point in the sales cycle been selling slowly, with sales outside of the peak Christmas week particularly sluggish. However, after they were able to refocus efforts and budget to The Nutcracker campaign, sales took off and the show run ended above target.

Using the Dashboard, they could identify shows which required additional focus – outside of the Christmas week – which meant they could focus marketing efforts on driving volume into these performances, while maximising revenue from those willing to pay for the optimal dates within Christmas week.
An interesting takeaway from working with the data in this way was being able to see that Saturday matinees sold most strongly across the run – not just within Christmas week as had previously been assumed. Historically these had been priced down but moving forward these will be priced in line with other performances to maximise income from the demand.
Using the Advantage Dashboard in the future
Beyond the weekly use of the Dashboard, BOV have identified some key questions they will use the Dashboard to answer:
- Having implemented a re-configuration of price bands, they want to assess how these new seating arrangements have impacted customer behaviour using the Hotseats functionality and sales by price band reports
- A family show is not selling well to BOV’s traditional family audience – they aim to use the mapping functionality to identify where their traditional family audience is coming from, then use the results to focus their outdoor activity in other family-dense areas in the city to try to drive new family audiences from beyond their database.
- Using the transactions tab, BOV has been able to compare shows’ sales cycles more accurately bearing in mind differences in sales cycle length. This has given confidence when comparing e.g. similar Christmas shows which are behaving differently; taking into account the length of sales cycle. Further analysis will inform planning on-sales in future.
- Using the Dashboard, they are hoping to interrogate demand across long-running shows to determine optimal production lengths for future performances

Interested in the Advantage Dashboard? Get in touch
Find out more about the Advantage Dashboard or contact us for a demonstration.


