Advantage Dashboard
Clear, immediate insight,
Inform your most critical strategic decisions with an analytics tool designed specifically for cultural leaders.
By connecting seamlessly with your ticketing system, the Advantage Dashboard replaces hours of manual reporting with instant, actionable insights.
Step back from the day-to-day and track exactly how your programming and pricing choices are impacting revenue.
With clear business intelligence at your fingertips, you can identify financial opportunities and risks early, equipping your team with the robust data needed to demonstrate trends to boards and funders.


Pricing tailored for your organisation’s budget
The Advantage Dashboard has been created by people who have first-hand experience of managing budgets in cultural organisations – our aim is to be affordable and valuable.
How much does it cost? →How we help
Analyse revenue
Forecasting and alerts streamline your dynamic pricing decisions and improve campaign efficiency.
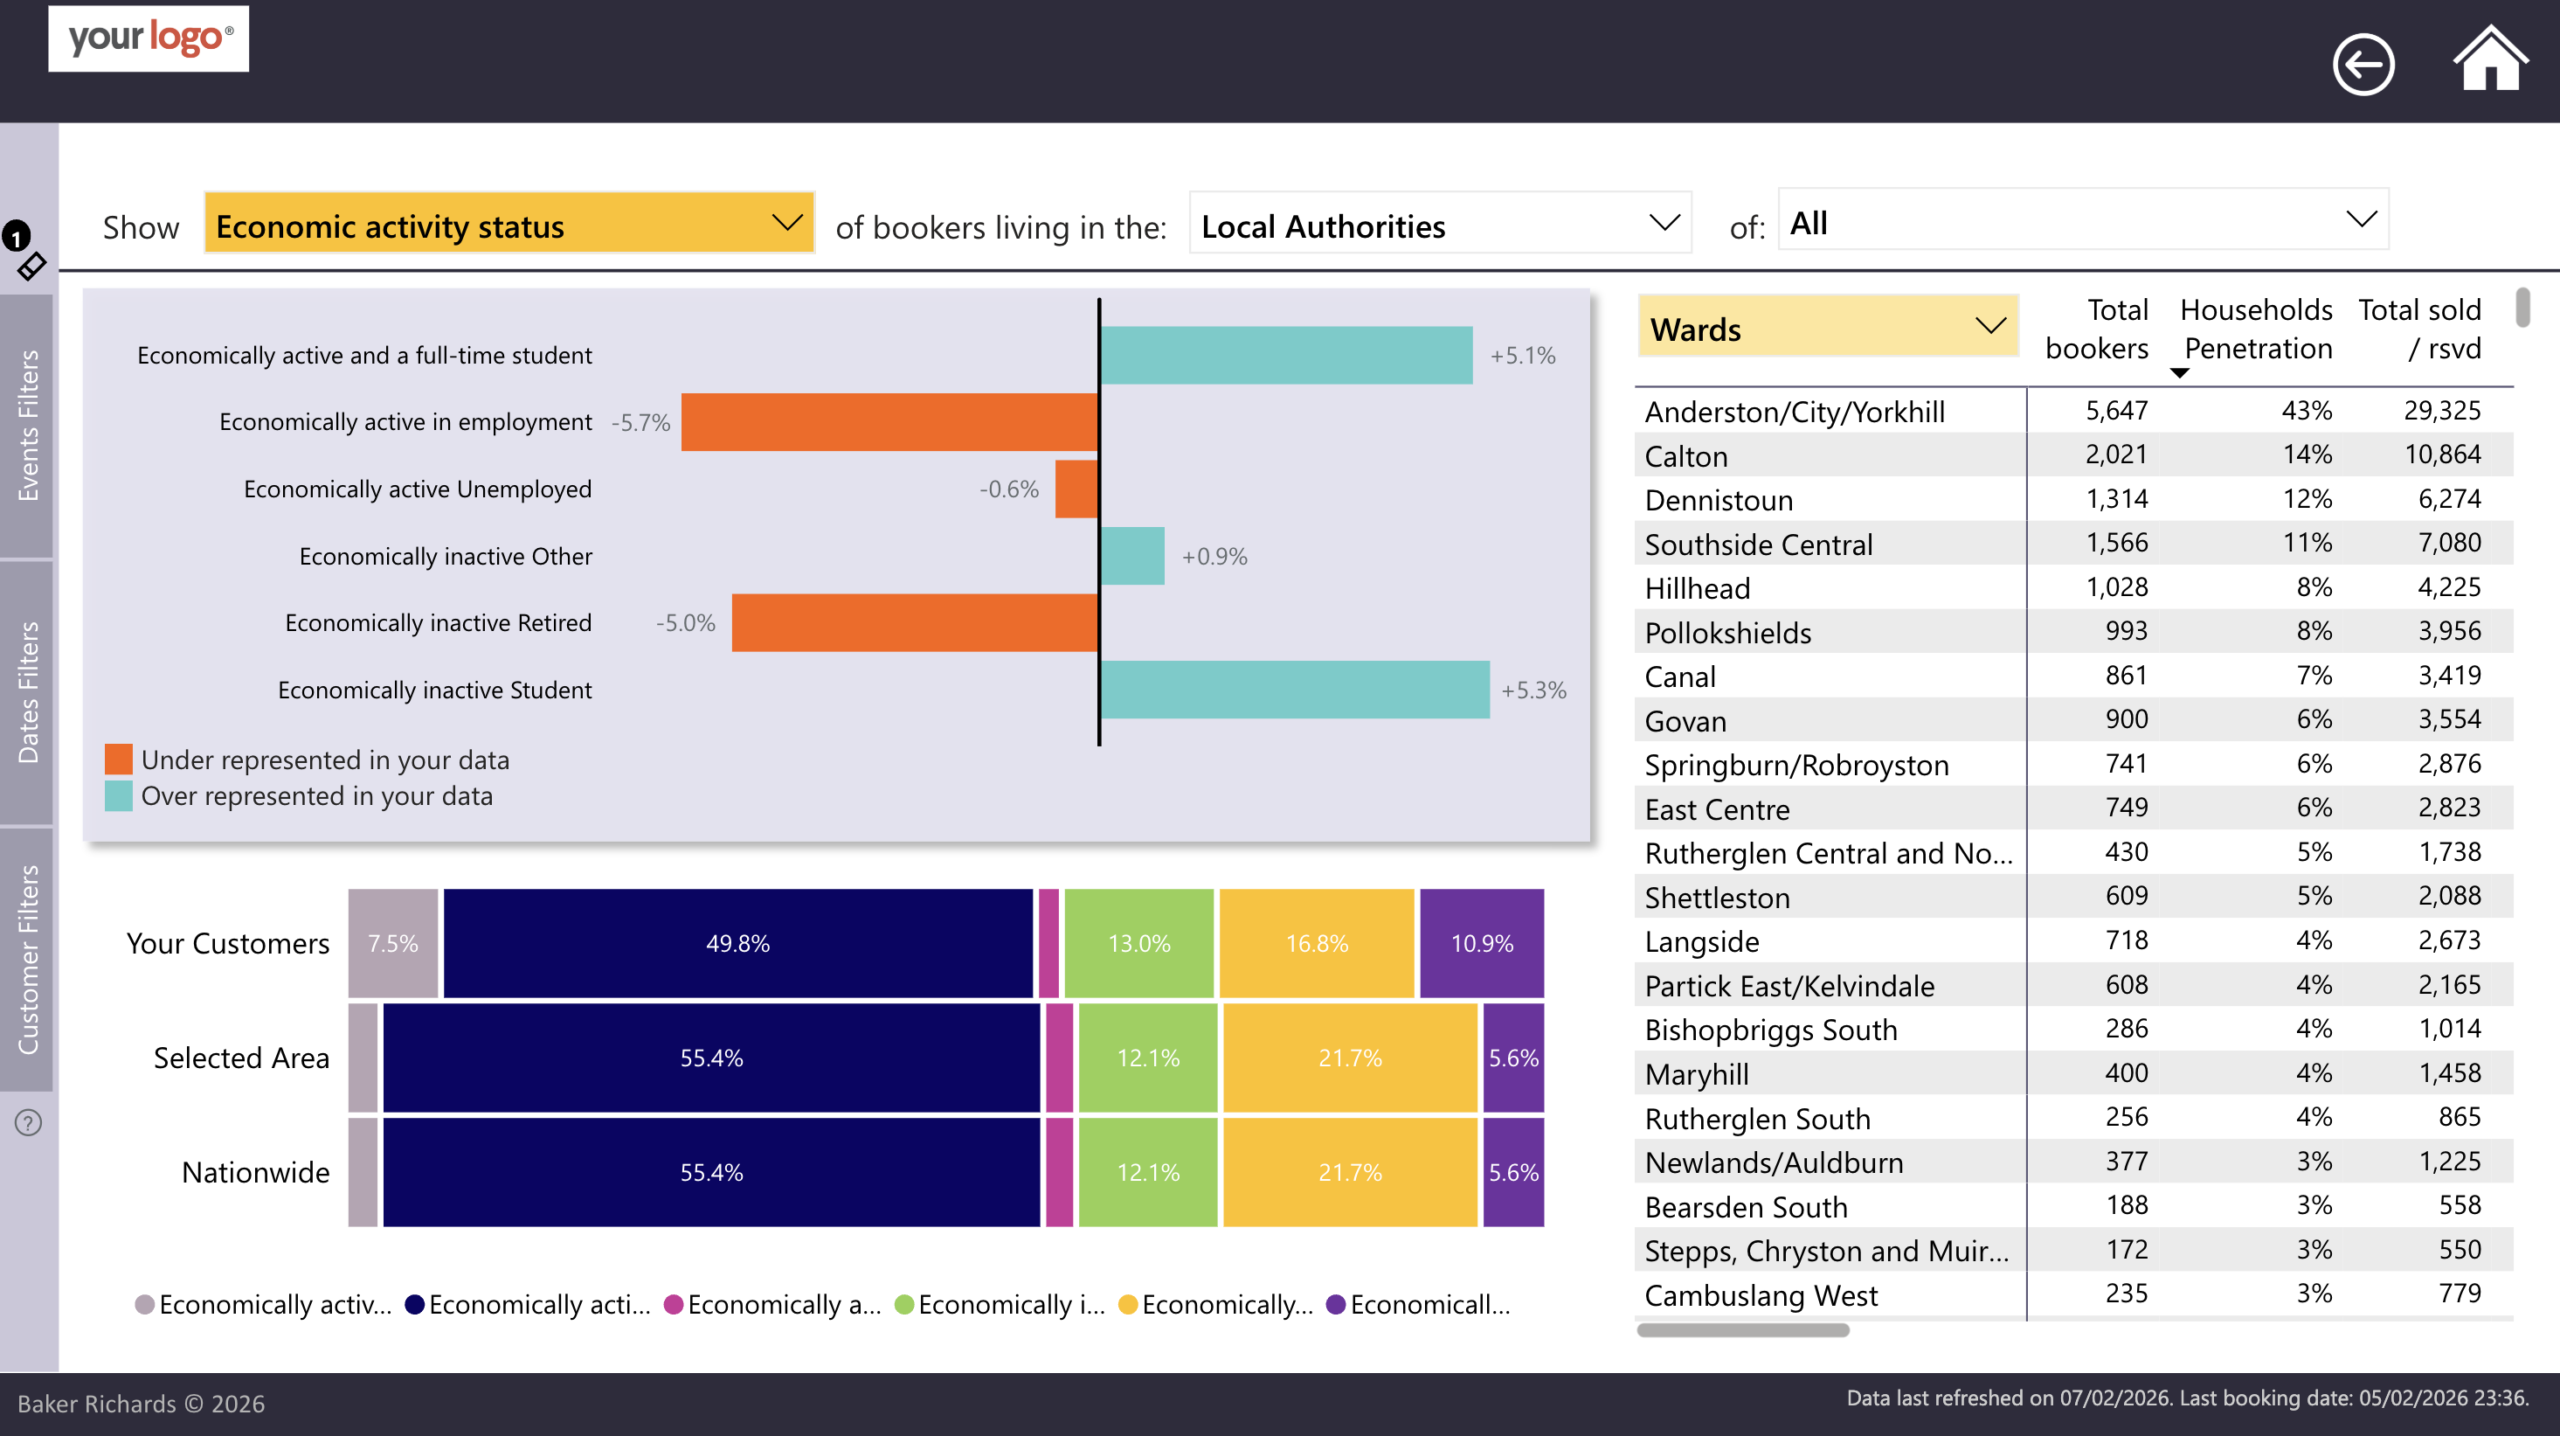
Analyse audiences
Unlock census data to understand who and where your audience are. Tag contacts for campaigns. Step up pricing, membership, and donation strategy.
We’re with you
A Baker Richards expert will connect your strategic goals to specific areas of the Dashboard. Join an interactive, expert-led training session for your team, and keep in touch with our regular round tables.
3 ways to grow your audiences
3 ways to grow earned income
3 ways to focus, report, and save time
Power your strategy with the analytics platform trusted by industry leaders


The Advantage Dashboard is an indispensable organisational tool for Leeds Heritage Theatres
Case study →Get in touch
Contact one of the cultural scientists at Baker Richards to discuss your unique requirements.
Contact