Selling Spare Inventory – London Symphony Orchestra
You’ve run a successful marketing campaign and sold lots of tickets but have you ever asked yourself whether they would have sold anyway? A better understanding of your spare inventory can help you focus on developing audiences for the inventory that would go unsold so you know you’re generating additional sales.
Most organisations have some idea of which of their events are going to be difficult to find an audience for and might also have some idea of particularly tricky times in the year, certain days or time slots when events struggle to meet their targets. But to what extent do you know what impact not selling that inventory will have on the bottom line?
Understanding not only where your spare inventory is likely to be over the course of the year, but also how much it is worth, is important information to help direct your resources appropriately. For example, you may have a large quantity of unsold inventory for a low priced event which might have less unrealised value than a small number of seats for a higher priced event.
- Firstly, you can predict where your spare inventory is going to be based on historical sales patterns (see Forecasting).
- Then you can create a plan for dealing with this on a case by case basis based on appropriate comparators (see Pricing Playbook).
- The third element in linking all of this together is identifying who the best targets are for that “difficult to sell” inventory and finding the right offer for them at the right time (see Behavioural Segmentation).
London Symphony Orchestra
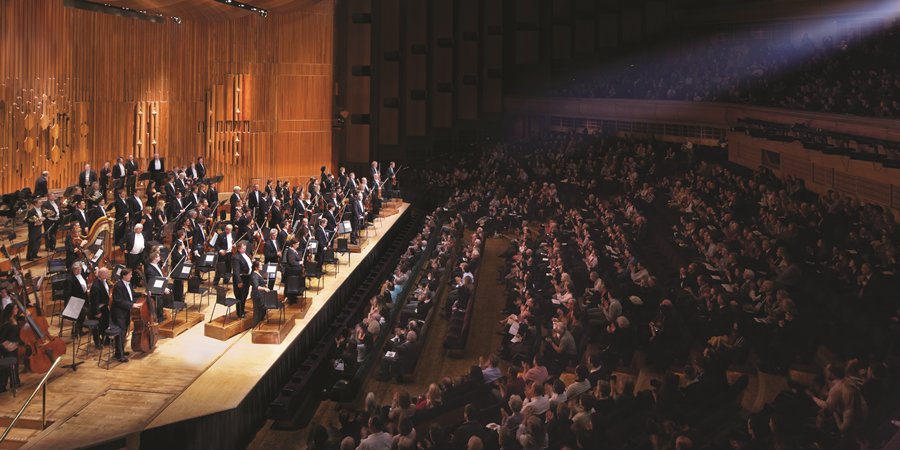
Since early 2016, we have been working with the London Symphony Orchestra (LSO) on their pricing and segmentation strategy. As part of this project, we undertook analysis of their past seasons to identify where opportunities might lie for maximising income and the sort of inventory that was difficult to sell. We also applied a standardised scoring system (see Repertoire scoring) to measure the appeal of all LSO concerts in the past three years. In addition to the volatility of sales on a concert-by-concert basis, we identified the “difficult to sell” areas of the auditorium to determine the range of prices of the unsold inventory.
Combining repertoire score and seat location along with type of concert (e.g. core orchestral or family) showed that the most popular repertoire (i.e. concerts with the highest repertoire score) had relatively little spare inventory and most of it was at the lower prices, while lower scoring repertoire – despite strong sales for top price seats – had spare inventory in the 2nd and 3rd price areas of the hall.
Unsurprisingly, most spare capacity for lower scoring concerts, but the biggest opportunity for maximising income was in selling additional tickets for the mid and high scoring concerts, which should also be more straightforward.

Who can you sell it to?
The marginal cost of selling additional tickets is close to zero, so logically there is an advantage to selling “difficult to sell” inventory at any price. However, reducing prices to attract new audiences is a dangerous strategy which can undermine the value of your product while being unlikely to generate the additional volume needed to compensate for reduction in price (see Price-Quality and the Danger of Free). The best prospects for buying the additional tickets are people who are already attending. These are also the people you know most about, including their repertoire and price preferences.
Generating additional ticket sales from your current audience can be achieved through:
- Increased retention: making sure (more) existing bookers return each year
- Re-activation: getting lapsed customers to come back
- Frequency: encouraging existing bookers to come to more events
- Party size: persuading bookers to bring more guests
Having worked with the LSO to create a behavioural segmentation model, we used this to overlay the segments against the spare inventory, matching the variables relating to price and repertoire for each segment against spare inventory. There were six main segments which each had different objectives for increased sales.
The resulting grid made it simple to link each segment with particular inventory. For example, the Super-Frequent segment were more likely to go to the lower scoring repertoire than the other segments. They also had a higher propensity to book either top price or bottom price seats so target inventory for this group was the more obscure concerts, but without offering discounts to those bookers within the segment that were willing to pay top price.


