Bare necessities: segmentation made simple
What’s the recipe for maximising engagement and income?
Segmentation means understanding your available market by breaking it up into manageable chunks, so that you can plan appropriate strategies. There are essentially three kinds of customer segmentation: demographic, attitudinal and behavioural (see: Segmentation: What, How and Why). The most sophisticated segmentations might use combinations of all three, with demographic statistics cross-tabulated with extensive survey data on people’s motivations for attendance.
But it doesn’t have to be that complex to get started. If you have an admissions database the most valuable kind of segmentation is within your reach: behavioural.
Behavioural segmentation
Behavioural segmentation is about what people actually do – what they buy and when. Because you already have that data, you can use it to:
- set clearly defined objectives
- translate strategy directly into action through targeting
- measure the results.
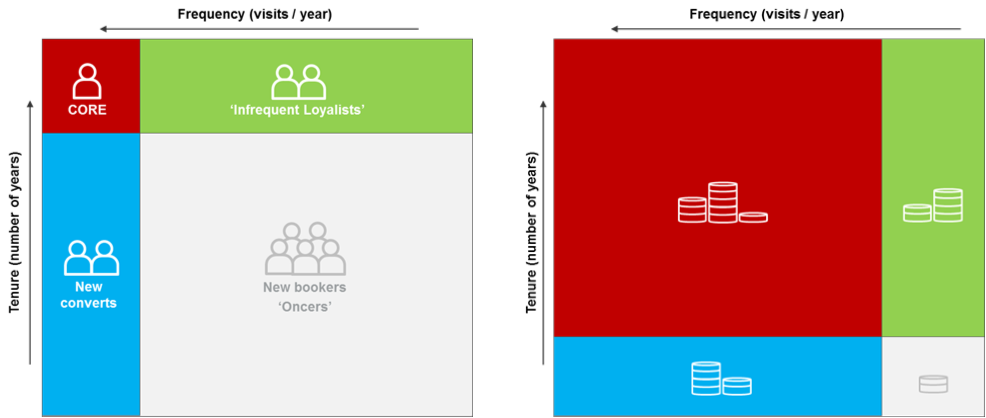
Many variables can be used to create a sophisticated segmentation matched to your unique operating model, but frequency of attendance is almost always the most important. A simple segmentation can be created using two measures: average annual frequency and number of years attended.
The core attenders
This is illustrated in the diagram below. Those attending both frequently within a year and across multiple years (‘Core’ in red) make up a small proportion of the customers of most organisations. But it’s crucial to remember that because they are attending so often, their contribution to total sales and income is disproportionately high (as shown by the second chart).

Often, this ‘Core’ are the people you already know most about, and potentially they will keep coming back with relatively little effort from you. More interesting from an audience development point of view are the next two segments.
Beyond the core
The first, here labelled ‘Infrequent Loyalists’, attend relatively infrequently but have come back in several years. This group is often undervalued by analysis focused on ‘annual frequency’ or on just last year’s data, and can be a challenging segment to develop. Can you increase their frequency? Or is this as frequently as they want to attend – in which case how do you ensure they are retained next year?
Here you may need to introduce a new variable to the model: what type of event do they attend? It might be, for example, that some only want to attend a particular genre which you only have once a year. It could also be unrelated to programming – are some coming for birthdays or anniversaries?
The second group are those who come more than once within a year, but have only done so in one year (or maybe two). In this chart they’re labelled ‘New Converts’, but this is the next thing to find out. Adding another variable, recency, you can find newly frequent people, for whom your strategy should be about moving them into ‘Core’, versus those who used to be frequent, but have lapsed. Then you can start to analyse why these people might have lapsed.
The ‘oncers’
Recency is also vital to understanding ‘Oncers’, usually the biggest group. You may well decide that those who came once four years ago should be dropped from any targeting whatsoever. You might also add a demographic variable here: geography. An international tourist is usually unlikely to return, at least any time soon.
To decide what might tempt a ‘Oncer’ back, there are more variables you can add. What kind of event did they attend? How far in advance did they purchase, and at what price?
Maximising engagement
A key objective of a CRM strategy is often to leverage the engagement of your Core group through subscription, membership and donations.
If you offer subscriptions, how many of your Core group are not subscribers? Analysing the behaviour of these people can give you insights into other areas of your strategy. For example, does your pricing policy leave loopholes that mean customers can attend what they want more cheaply without subscribing? Is there an alternative model that can help with the engagement of ‘Infrequent Loyalists’ without cannibalising on subscribers?
Over all of this you can overlay members. What proportion of each group are also members? Do the benefits of subscription and membership support each other or clash? Might membership be the way to engage with ‘Infrequent Loyalists’ who don’t want to increase their frequency?
If you have non-member donations, are donors just a subset of the Core, or do other, apparently less engaged customers, make donations? If they do, how does that change your view of their long-term engagement potential? You may also find a segment of people who have donated or have a membership, but do not appear to be attending.
Strategy to action
The main benefit of this approach to segmentation is that it can be immediately operationalised. You can set SMART objectives for each of your segments – your target customers – and evaluate using the same simple measures of frequency and recency. You can build incrementally on these foundations, adding variables to achieve more and more sophistication.
First published as “Bare necessities” by Arts Professional, 7 December 2017, artsprofessional.co.uk


